Nameless Range
Well-known member
I don’t use any of the hunting applications strategy apps or resources, so forgive me if they’ve already done this. In fact, anyone who has already done this has likely done it better.
FWP has a resource for downloading the historic draw stats of yesteryear – found here. It goes back as far as 2006.
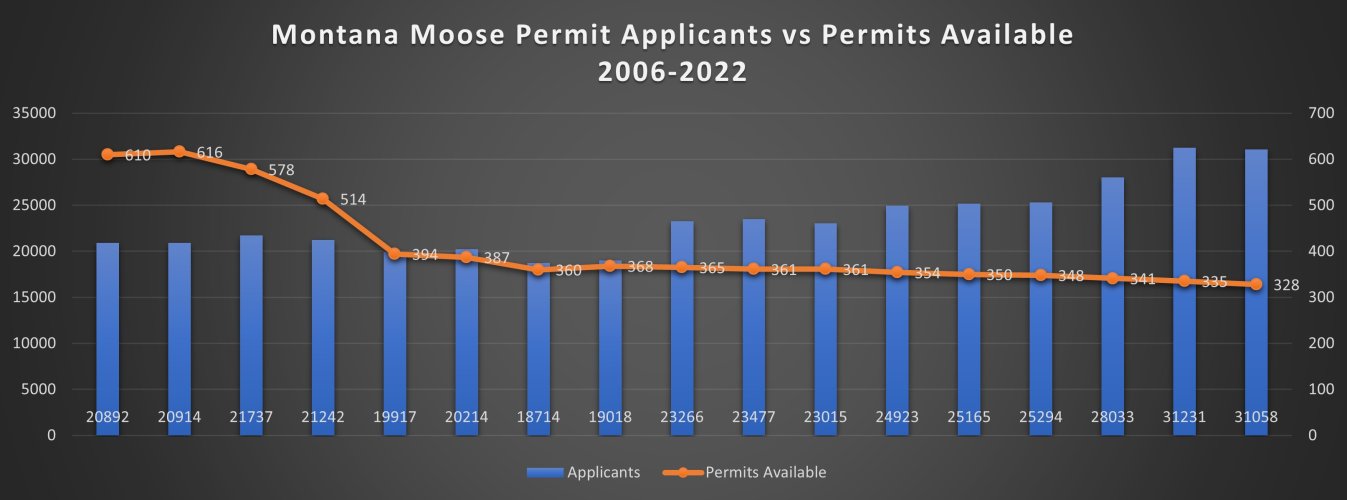
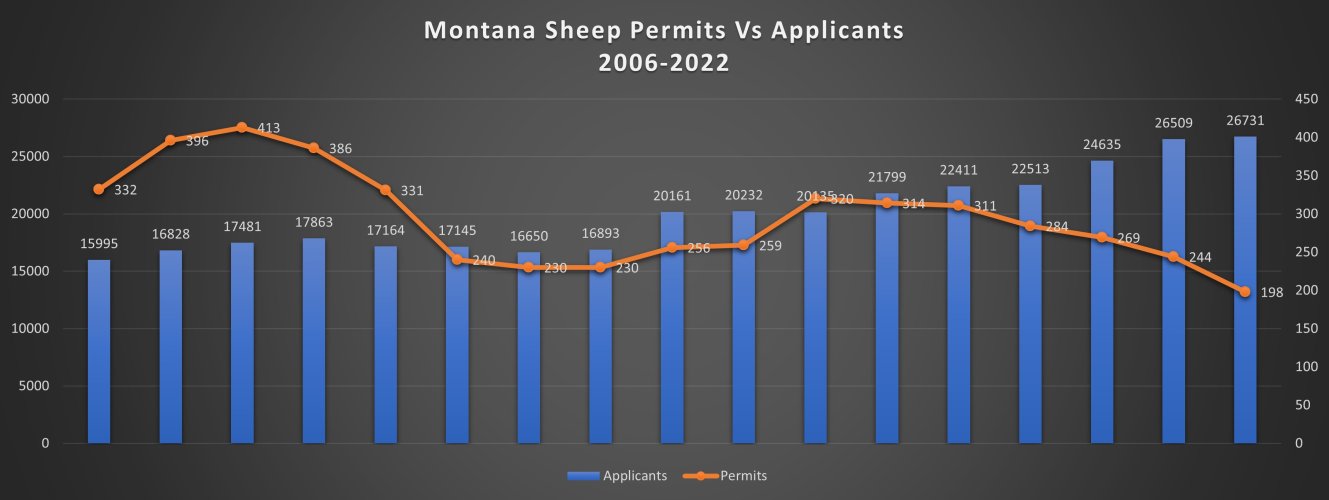
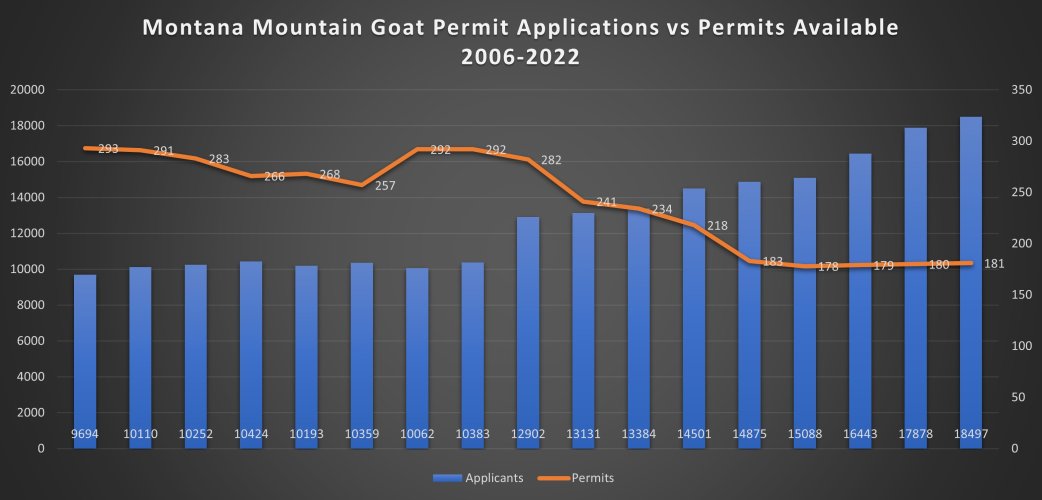
I didn’t do it exactly right in terms of an apples to apples, but for Moose, Sheep, and Goat, I consolidated the 1st choice Resident Applicants and the Permit Quota that was on offer that year – didn’t take into consideration NonResidents, and did the moose a bit differently, but I charted it out over time. For sheep, I omitted the unlimited districts because it would’ve taken a bit more work. Don't take these exact numbers as exact, because I kind of rushed through it, but I think the story stays the same.
The histogram values are applicants, and those totals are on the left axis. Permits on offer that year are the line value, and those are labeled on the right axis. Every chart starts at 2006 and ends with 2022.


Unsurprisingly, for all 3 species there are more applicants now than there were 16 years ago. Something that doesn’t make sense though, is the precipitous drop in permits available. Yes, sheep have their issues with disease and yes moose have parasites, but these aren’t problem-animals, they aren’t overpopulated, and I wonder if we are “managing” them properly.
On all three species the permits available is seemingly ever-decreasing – taking the decrease in one’s odds due to growth of the applicant pool and exacerbating it.
Some thoughts:
-I wouldn’t be surprised if a day came that certain someones tried to inject landowner preference into the Big 3.
-We are already at a point where tens of thousands are vying for a couple hundred permits. What happens if trajectories for both hold, and it is tens of thousands more vying for dozens of permits? At what point do we ask ourselves if we should even be hunting these species at all?
I ask this of myself right now, and yet apply every year.
FWP has a resource for downloading the historic draw stats of yesteryear – found here. It goes back as far as 2006.
I didn’t do it exactly right in terms of an apples to apples, but for Moose, Sheep, and Goat, I consolidated the 1st choice Resident Applicants and the Permit Quota that was on offer that year – didn’t take into consideration NonResidents, and did the moose a bit differently, but I charted it out over time. For sheep, I omitted the unlimited districts because it would’ve taken a bit more work. Don't take these exact numbers as exact, because I kind of rushed through it, but I think the story stays the same.
The histogram values are applicants, and those totals are on the left axis. Permits on offer that year are the line value, and those are labeled on the right axis. Every chart starts at 2006 and ends with 2022.


Unsurprisingly, for all 3 species there are more applicants now than there were 16 years ago. Something that doesn’t make sense though, is the precipitous drop in permits available. Yes, sheep have their issues with disease and yes moose have parasites, but these aren’t problem-animals, they aren’t overpopulated, and I wonder if we are “managing” them properly.
On all three species the permits available is seemingly ever-decreasing – taking the decrease in one’s odds due to growth of the applicant pool and exacerbating it.
Some thoughts:
-I wouldn’t be surprised if a day came that certain someones tried to inject landowner preference into the Big 3.
-We are already at a point where tens of thousands are vying for a couple hundred permits. What happens if trajectories for both hold, and it is tens of thousands more vying for dozens of permits? At what point do we ask ourselves if we should even be hunting these species at all?
I ask this of myself right now, and yet apply every year.


