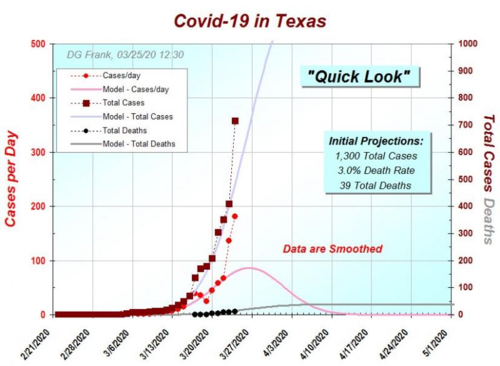
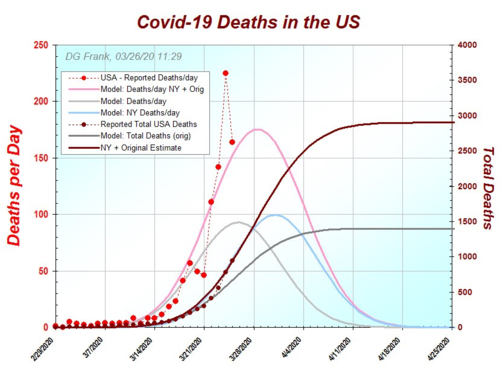
Y'all can follow along with me in my state if you would like. Dr. Frank makes a note on this model about the sudden increase in reported cases (the red dots above the pink curve). I posted it below the model. @ImBillT, this might help to answer your question at least partially about the different methods of testing in different areas and how that affects modeling. Number of deaths is the most accurate variable in the equation because we know fairly close the true numbers of people dying from corona. The number of reported cases is less reliable so it doesn't "carry as much weight" in the model as the number of deaths. They are compared together and some judgement is used based on how the models behaved in the countries that are further along in this ordeal.

Covid-19 "Quick Look at Texas"
Just added data. Clearly a testing artifact. We've learned to ignore these for a couple days, then revise the forecast.
Remember, a sudden increase in reported cases will correspond to a sudden increase in deaths, if it is real. Otherwise, the sudden increase in positive test results merely reflects detecting a higher *fraction* of the cases, not a real increase in the number of cases.


