Covid-19 Data, Models, References - NO DISCUSSION

Status
Not open for further replies.
You REALLY need to lose that guy. Deaths are climbing 20% day after day. They are not close to cresting. My guess is he will keep modifying his model as data comes in and presto have the right numbers after its all over.
Death counts are doubling about every four days. In 16 days we'll be at 23-24k if we follow the same rate.
 
As I write this the deaths/day today are up 48.5% from yesterday's rate. Damn.
 
Not sure what I am doing wrong. March 25th death/day was 1027 today was 1295 . I figured the increase of the death rate at 26%
 
I know not everyone is a fan of Dailywire but this is good news for getting test results MUCH quicker.

 
Some insight into his thinking and analysis. Louisiana had an up tic in deaths that is not following the model. He will evaluate and make changes if needed. He has local people help him to see what may be causing the up tic. I added a note from his discussion below.

View attachment 133168

‎Douglas G Frank‎ to Dr. Frank Models
25 mins

Just added data, which are tracking well... except the death rate.
So I want to increase the death rate. But let's hold off and do a controlled "thought experiment."
Someone look into this. Is there a rest home that got hit? Or some other peculiar circumstance? If so, then the data told us this. Perfect.

By Nick Gremillion and Lester Duhé | March 23, 2020 at 12:54 PM CDT - Updated March 27 at 2:00 PM
BATON ROUGE, La. (WAFB) - Officials with the Louisiana Department of Health announced Friday, March 27 they have identified COVID-19 clusters in eight nursing homes in the state.

 
Check out interesting human behavior study. Can check by nation/state/county. FWIW....
I put up MT, "unaffected" counties vs. "infected" counties - a telling as well as interesting story. Granted rural folks may/will travel more to reach services, etc., normally.....

edit: MT did not come up on link - but one can use MT - or wherever- as a case study ......

I saw this link a few days ago. It seems to me that the method really doesn't capture the difference in rural areas vs more urban areas. For instance, every day, this time of the year, I travel five miles each way to feed my horses. At no time am I within close contact with anyone. If I need to go to town to get groceries, the drive did not get shorter due to the virus. It does not factor in that, that the shopping is done at times to minimize the number of other shoppers in the small town grocery store.

We are definitely sheltering in place, but any chore involves a drive of some distance.

This ^ , Why I deleted the text. Subtle (attitude/behavior) as well as glaring (logistical) nuances. As goes understanding of viral transmission.........
 
Italy suggests that 5000-6000 per day in the US is plausible.


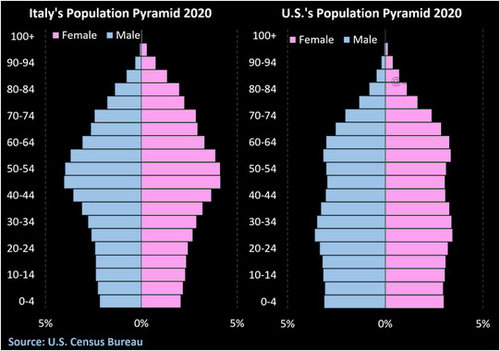
We will NOT be like Italy, the graph below shows exactly why Italy (and Spain) have many more deadly cases than we do. Their populations skew toward older age ranges, which are more susceptible to serious infection.

original.jpeg
 
We will NOT be like Italy, the graph below shows exactly why Italy (and Spain) have many more deadly cases than we do. Their populations skew toward older age ranges, which are more susceptible to serious infection.

View attachment 133371

I agree. Italy is one of the hardest hit nations in the world in just about every flu season. I don’t know why any other lower respiratory virus would be any different. Italy is a bit of a worst case scenario.
 
Wuhan traffic is still pretty much nonexistent.


You can look at the graph for 48 hours or the last 7 days. Both are WAY below normal.
 
Status
Not open for further replies.

Forum statistics

Threads
113,671
Messages
2,029,135
Members
36,277
Latest member
rt3bulldogs
Back
Top