Caribou Gear Tarp

North Yellowstone Flooding

Lots of ways we can tax first responders.

Driving unnecessarily in hazardous weather.
Backcountry travel during extreme avalanche danger.
Traversing areas of high grizzly bear concentration.
Drinking too much beer and making TikTok videos.

Back to flooding.
 
No, primarily attention whores who have their friends video them doing this stuff to post on social media. Or even better strangers video them and post pics to their social media. Half of people think it's cool. Other have think it's dumb. But they all are giving these guys the attention that they crave and the followers for social media.

Every catastrophe is a social media opportunity.
You know, guys were doing this long before social media. Adrenaline junkies live among us. While I would never do this (rafter not a kayaker), my buddies and I have run some rivers in rafts that were pretty out there. Never filmed a thing.
 
Went up the Stillwater yesterday to check on my parents place- the road near the Rockin' J washed out after I'd gone across. The bridge out of Absarokee along the Stillwater was closed, Roscoe was washed out. Johnson Bridge was hanging in there, but the Jack Stone Creek road / N. Stillwater road was water covered and didn't look like it would hold up for very long. The only access in/out is through Reed Point and Jack Stone Creek Road.

The Stillwater peaked at 23900 CFS in Absarokee yesterday. The previous alltime high I can find on USGS is 10900 CFS.
Is that all time high for that particular day or the highest ever recorded? People (including me) were thinking that the max value on the USGS site for the Yellowstone (30,000 cfs) was the highest ever, but it is actually the highest on that particular day.

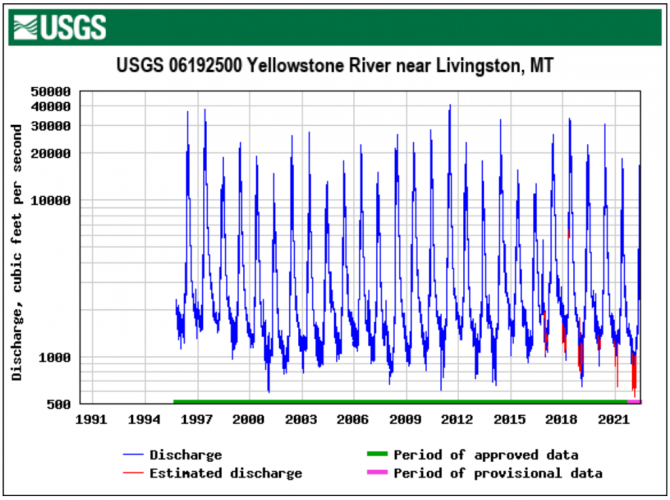
If you look at the history you can see Yellowstone flows even touched 40,000 cfs one year, but that is still much less than the 50,000 cfs yesterday.

1655249946100.png
 
Is that all time high for that particular day or the highest ever recorded? People (including me) were thinking that the max value on the USGS site for the Yellowstone (30,000 cfs) was the highest ever, but it is actually the highest on that particular day.

If you look at the history you can see Yellowstone flows even touched 40,000 cfs one year, but that is still much less than the 50,000 cfs yesterday.

View attachment 226059
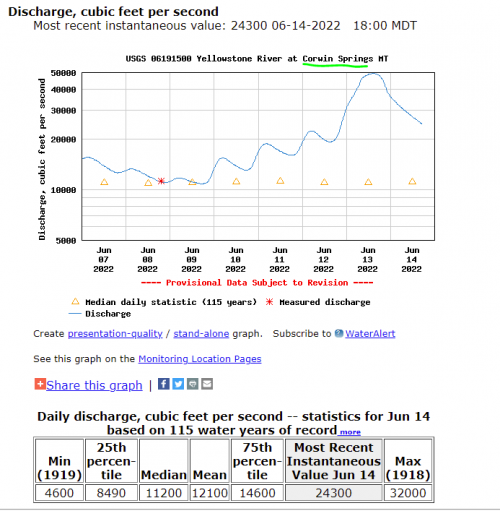
I believe most people were referencing a higher gauge. Corwin Springs previous high was 32k. Hit 50k yesterday.
1655252162830.png
 
Ennis and Virginia City are packed with tourists. Everyone that was planning to go to the park had to find somewhere else to go.

I read that they’ve said the North Entrance will not open again this year. Going to be a rough year for Gardiner.
 
Ennis and Virginia City are packed with tourists. Everyone that was planning to go to the park had to find somewhere else to go.

I read that they’ve said the North Entrance will not open again this year. Going to be a rough year for Gardiner.
Yeah I was in Shedhorn Sports yesterday.
I will refrain from further comments.
 
Shedhorns has some of the best gun prices (historically, have no idea about now), so go to town.
 
Man I wish I was better at communicating.

Yeah, I knew it was the Stillwater and a different spot on the Yellowstone, but the question was whether or not the "max" everyone is quoting is just for that particular day or the max ever recorded. I think the max at Corwin Springs was at 30,000 yesterday so it must refer to the max on that particular day and not the max ever recorded since today it is at 32,000.

The max at Livingston is 31100 today, but the historical flows have touched 40,000 so, again, it seems like the number is just for that particular day.
 
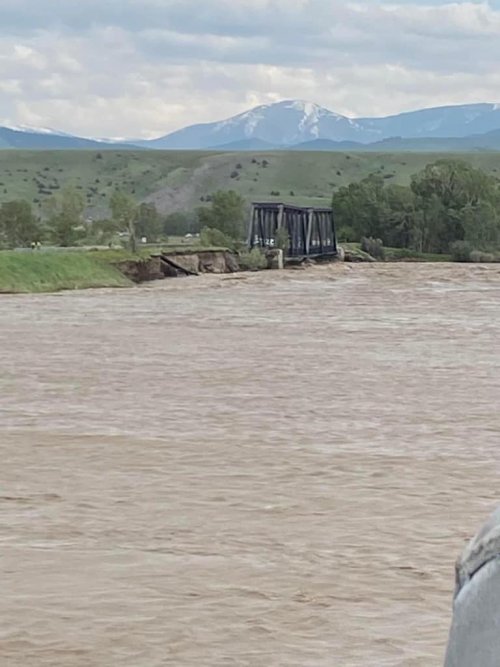
Also, the 89 N bridge heading up the Shields has been closed. The old railroad bridge is starting to sag and is likely to collapse. Who knows if itll take out the highway bridge. hopefully not.

Picture from the web:

288415848_1872140429843363_3320672702003300159_n (1).jpg

This was a few hours ago. I went over it into town earlier to help out on the island but couldnt on the way back.
 
What a catastrophe. A lot of really good people and some of the best places in the state won’t be the same for a long time.

I’m sure there’s a lot of people and organizations that need help and that would be worthy of giving to.

This particular family are some of the nicest folks I know, and would never ask for this or anything from anybody, but this has been set up for them. If you’re inclined to give, I can tell you that this family would not squander your dollars.

https://www.gofundme.com/f/flooding...PRCcgrM69VpRLF-U8s1qbKUGXQVH6RV9bEg&fs=e&s=cl
 
Man I wish I was better at communicating.

Yeah, I knew it was the Stillwater and a different spot on the Yellowstone, but the question was whether or not the "max" everyone is quoting is just for that particular day or the max ever recorded. I think the max at Corwin Springs was at 30,000 yesterday so it must refer to the max on that particular day and not the max ever recorded since today it is at 32,000.

The max at Livingston is 31100 today, but the historical flows have touched 40,000 so, again, it seems like the number is just for that particular day.
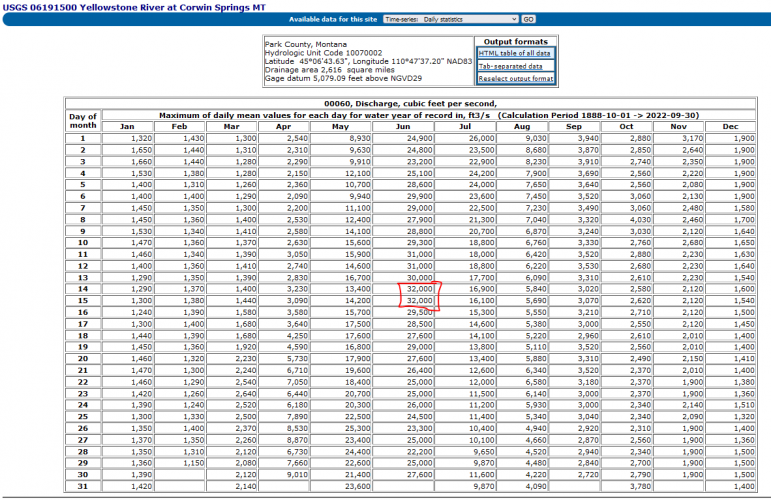
Rob, I don't think you're bad at communicating, but I think you're getting confused because the max record at Corwin was on the same day in 1918. This table represents the max discharge every day, all year for the entire period of record.
1655265377670.png
 
Man I wish I was better at communicating.

Yeah, I knew it was the Stillwater and a different spot on the Yellowstone, but the question was whether or not the "max" everyone is quoting is just for that particular day or the max ever recorded. I think the max at Corwin Springs was at 30,000 yesterday so it must refer to the max on that particular day and not the max ever recorded since today it is at 32,000.

The max at Livingston is 31100 today, but the historical flows have touched 40,000 so, again, it seems like the number is just for that particular day.
The table above, at the bottom of @neffa3 's post, are "daily" values, not instantaneous values. The 32,000 cfs (1918) is the highest daily discharge computed at that station for that particular day of the year (June 14), and it occurred in 1918. The "daily discharge" is frequently computed using the average of 96 individual measurements, obtained 15 minutes apart over the course of 24 hours.

For the maximum instantaneous peak occurring during a year, go here:
https://nwis.waterdata.usgs.gov/mt/nwis/peak/?site_no=06191500&agency_cd=USGS

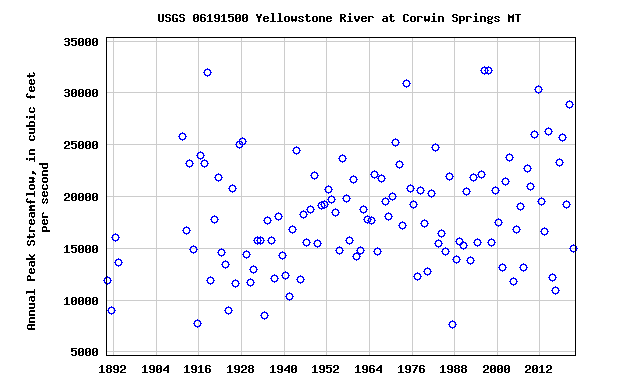
You can table/sort and see the max instantaneous discharge at the Corwin Springs gage was 32,200 cfs and it occurred three times during the station's period of record.

Interesting that the max and min values for daily discharge at that gage occurred in 1918 and 1919, back to back.
 
Rob, I don't think you're bad a communicating. But I think you're getting confused because it max record at Corwin was on the same day in 1918. This table represents the max discharge every day, all year for the entire period of record.
View attachment 226090

Just clarifying, those are maximum daily values, NOT maximum instantaneous values. I think that is where a lot of folks get tripped up, understandably so.
 
Just clarifying, those are maximum daily values, NOT maximum instantaneous values. I think that is where a lot of folks get tripped up, understandably so.
Yes and no.
In 1918 they didn't have data loggers recording every 15 min.
1655267110785.png

Per the USGS the highest annual flows recorded for Corwin are the same as the "daily mean" maximum values. If you can provide true instantaneous data in 1918 that indicates there were greater flows than have been shared, then please post them up, I'd love to see them. There was certainly a point where we started collecting data at frequencies greater than 1 per day, at which point it appears the we moved to daily mean flows for long-term record keeping.
 
Thanks neffa and jeep, that’s what I was looking for. Given that data, do you know what the odds are that we’d get a 50k cfs day?
 
Yes and no.
In 1918 they didn't have data loggers recording every 15 min.
View attachment 226093

Per the USGS the highest annual flows recorded for Corwin are the same as the "daily mean" maximum values. If you can provide true instantaneous data in 1918 that indicates there were greater flows than have been shared, then please post them up, I'd love to see them. There was certainly a point where we started collecting data at frequencies greater than 1 per day, at which point it appears the we moved to daily mean flows for long-term record keeping.
Correct, electronic data loggers were not a thing. There were recording gages (strip charts) and a variety of nonrecording gages with observers taking periodic notes. I used the 15-minute data example because it's how most stations currently operate and it allows folks to better understand what a "daily mean discharge" value actually represents.

The table posted above (post 175) is a table of "Maximum daily mean values". It is not a table of peak flows (instantaneous discharge). The max instantaneous discharge for each day of the year was not published, historically. What was published historically was the maximum instantaneous discharge for the water year, the associated gage height, and the date of occurrence. Going back into 1918, it's certainly possible that a peak flow was used as a max daily mean. I'd have to dig back into the water supply paper which published the record for that year to better understand.

I'm not indicating that there are any higher flows than what is published in the peak flow file, so I'm not following your questions on posting up flows which are greater than those currently published?

I was mistaken when I posted that 32,200 occurred three times, it was two. End of the day oversight.
 
Thanks neffa and jeep, that’s what I was looking for. Given that data, do you know what the odds are that we’d get a 50k cfs day?
I'm a civil engineer in Hydraulics with the state - our consultant on the ground told me that the Yellowstone and Stillwater were both above the 500-yr flood. That is represented as a 0.2% chance event, but I'm bad at statistics and even worse at explaining statistics, so I'll just leave it at that.
 
Back
Top