Inflation

SAJ-99

Well-known member
Joined
Jan 5, 2019
Messages
6,008
Location
E Washington
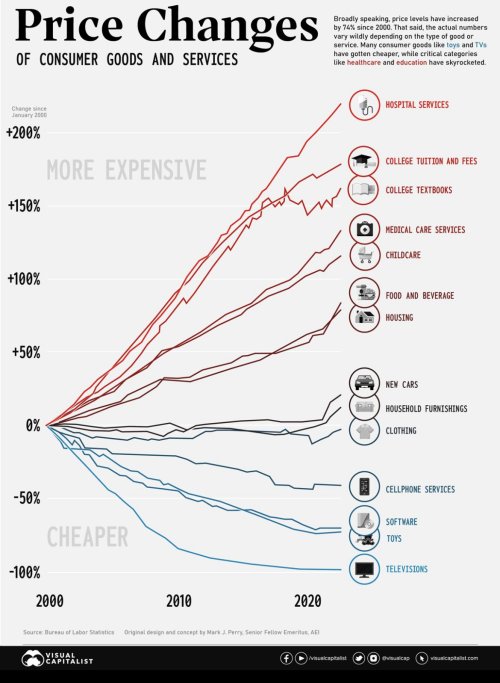
Interesting chart on the inflation of various components over the last 20+ years. Ties in with @VikingsGuy thread on student loan relief. You can argue almost anything that fits your belief. The highest inflation is in those items that have a heavy government subsidy. But also those things that can’t be easily outsourced to other countries.
41CC7C17-9840-4FC5-9627-CF6513549E37.jpeg
 
From 1970 to '85 the US averaged 7% for 15 years.

The US has had 7% for 2 years.

Inflation is nothing like it was then.


The federal govt paid over 50% of costs of colleges and universities through land grants and the GI bills until the early 1980's.
Until then few had student loans because school was free.

Under Reagan the Fed govt reduced school subsidies and turned it into student loans.
 
Last edited:
Other than new cars, (and again, the chart should include data to at least 2022), the chart might be re-labelled, as:
Things which can be produced by slaves/child labor/sweatshops vs things produced in a free market with fair (often union) wages and benefits.

Not to say the cost of Higher Ed is not out of control, as it is, but the rest is the result cheap off-shore labor in often abhorrent conditions.

Funny how we care about slaves of 200 years ago but care little for the ones today.

Enos Cantor Freedom covered some of this if you wish to search it.

And hospital services is a completely different animal. Services are denied to no one, and someone (taxpayers, the insured) pick up the tab.
 
Saw a half ton pickup very similar to mine on the lot the other day $68k, paid $39k for mine 6 years ago. I dont think those ptices are ever coming down but i think poeple are going to be trading in a lot less frequent. I know I sure will.
 
I love that "infographic" when I want to beat on govt involvement ;)

But seriously, there are most likely 3 reasonable explanations - and I would guess it is not any single one, but a mix of the three that account for the observation:

1. Economic inefficiencies driven by government involvement.
2. An average of the upper trend lines reflects a more natural US rate of inflation, but for the downward price pressures of offshore labor.
3. Government increases demand for certain goods/services by making them more available to a larger number of people and this is the expected result from a price/demand curve.

#1 is bad, #2 is what it is, and #3 is probably good in a reasonably fair and stable society.

This leaves us with two big questions as a nation: (A) How do we minimize #1 in the appropriate pursuit of #3; and (B) are we willing to give up the savings in #2 as we seemingly seek to dismantle global trade?
Well yeah… but do you really want Walmart medicine?

On that issue I’m 100% for government involvement, we shouldn’t decide whether you live or die purely on your credit score.

I’d argue too that it’s politics as much as inefficiency, I get that it’s chicken or the egg a bit.
 
I love that "infographic" when I want to beat on govt involvement ;)

But seriously, there are most likely 3 reasonable explanations - and I would guess it is not any single one, but a mix of the three that account for the observation:

1. Economic inefficiencies driven by government involvement.
2. An average of the upper trend lines reflects a more natural US rate of inflation, but for the downward price pressures of offshore labor.
3. Government increases demand for certain goods/services by making them more available to a larger number of people and this is the expected result from a price/demand curve.

#1 is bad, #2 is what it is, and #3 is probably good in a reasonably fair and stable society.

This leaves us with two big questions as a nation: (A) How do we minimize #1 in the appropriate pursuit of #3; and (B) are we willing to give up the savings in #2 as we seemingly seek to dismantle global trade?
Good points. Interesting that I have never heard a Physician or Surgeon not complain about Medicare/Medicaid reimbursement rates. So I need to do some digging on how #1 is calc’ed in this graph.
 
Good points. Interesting that I have never heard a Physician or Surgeon not complain about Medicare/Medicaid reimbursement rates. So I need to do some digging on how #1 is calc’ed in this graph.
Medicare was already in place in 2000 when this graph starts so any govt discount was already baked it.
 
1. Economic inefficiencies driven by government involvement.

I agree with this for sure as it relates medicine cost explosion.

In addition: declining public health and wellness in general, aging demographics, and changing expectations of healthcare for older people all factor in to the healthcare explosion as well imo.
 
I should note to all that what we are looking at is relative price increases vs. total inflation. Not nominal $ price increases. In other words, the change in the price of the car relative to the change in prices of everything.

To @VikingsGuy, how the calc is done for items can turn the argument in its head. For example, college tuition trended in line with overall inflation until the 80s. Two things happened, as @Huntin' Fool pointed out, the US government stopped directly funding education and students had to take out more loans, and the demand for US college education by foreign students began to increase while “supply” didn’t adjust as fast.

In the Hospital services number there are no Medicare prices in that number. Because these numbers are so hard to find and can vary widely, I believe it(or part of it) is calc’ed using the retained earnings adjustment. So “profit” from insurers. Often in these discussions it is easier to work backwards into a narrative rather than try to find a true explanation. It is easy to say “It’s the government’s fault” so Politicians do it but economists do it too. The answer tends to be “a little of all of the above”.

Original credit to Mark J Perry, here https://www.aei.org/carpe-diem/chart-of-the-day-or-century-8/
 
declining public health and wellness in general, aging demographics,
Chicken-egg problem here. The healthier you are the older you tend to live. The older you live the more health problems you have. If we removed government involvement from healthcare, would only the rich get older? No one would support a complete removal, but we may have to decide what society pays for and what it doesn’t. Politicians like to call that the “death squads” debate.
 
Good points. Interesting that I have never heard a Physician or Surgeon not complain about Medicare/Medicaid reimbursement rates. So I need to do some digging on how #1 is calc’ed in this graph.
Physicians usually complain about these rates because the government pays pennies on the dollar to what private insurance would pay.

 
Good points. Interesting that I have never heard a Physician or Surgeon not complain about Medicare/Medicaid reimbursement rates. So I need to do some digging on how #1 is calc’ed in this graph.
Doctors used to be rich. Now hospital admin is rich.

People think doctors are rich because they pull in a few hundred thousand dollars a year.
Sounds like a lot until you realize they’re like 35 before they get to start making any money and are hundreds of thousands of dollars in debt, and hundreds of thousands of dollars behind in retirement investment.
 

Forum statistics

Threads
113,675
Messages
2,029,334
Members
36,279
Latest member
TURKEY NUT
Back
Top