Elk results tomorrow for WY

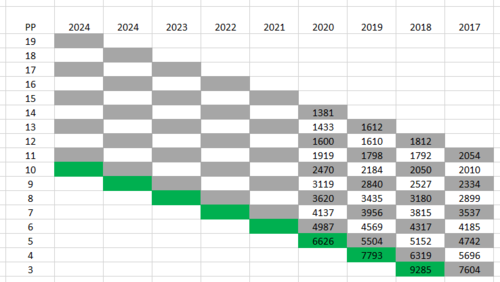
here is the chart I've been keeping up to date to keep an eye on the creep. If you follow the numbers horizontally, you can see the number of people with that many points just keeps going up. Its sickening as my goal was to get a tag in a unit that took 7 points when I started. It was around 3000 people with that many points. Right now its drawing with 9 which makes sense because there was 3119 people with 9 points going into the draw this year. Using this tread, by the time I hit 12 points, I should be able to draw it. Rough stuff...
1590152158769.png
 
Does anyone know where to find a more specific unit breakdown of application numbers? I emailed game and fish this winter and they gave me a chart but I think they misunderstood me. In the drawing odds they blanket all the applicants that are 1 or 2 points below the draw eg. <9 pp 136apps. I am just curious who is applying for the unit with 8points and how many with 7 points etc..
 
Does anyone know where to find a more specific unit breakdown of application numbers? I emailed game and fish this winter and they gave me a chart but I think they misunderstood me. In the drawing odds they blanket all the applicants that are 1 or 2 points below the draw eg. <9 pp 136apps. I am just curious who is applying for the unit with 8points and how many with 7 points etc..

you mean other than the detailed hunt draw stats they publish day of the draw including yesterday?
Know of nothing mor granular than that.

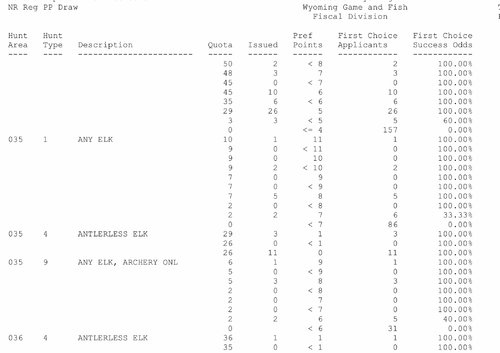
Here is a snippet. It shows for example in unit 35 2 guys drew with <10 points and there were 2 applicants at that level. By definition that means two guys with 10 and 11 points respcetively pooled an app and had 10.5 points in the draw as a group. So for me I know that if I had 11 pts I would get a tag ahead of them , but if I pooled with buddies and we averaged 10.33 points we would be behind the guys with 10.5 pts

I think their data is pretty robust and reasonably gets me what I need to strategize while not having to cruch numbers to do it.

granted it is not a table of applicants per points level. To me it is one step better as it identifies pooled applications and pretty precisely how the tags were allotted, and tags remaining at each whole and partial point level as the draw proceeded.

2EDC6064-674E-49F5-91F6-905C57E04A36.jpeg
 
Does anyone know where to find a more specific unit breakdown of application numbers? I emailed game and fish this winter and they gave me a chart but I think they misunderstood me. In the drawing odds they blanket all the applicants that are 1 or 2 points below the draw eg. <9 pp 136apps. I am just curious who is applying for the unit with 8points and how many with 7 points etc..

I don't know if they have that information, maybe but you'll probably have to request it and be specific.

I also don't think you'll be able to get much valuable information from that, people jump around chasing the latest rumors, etc. Its not like the people that applied in the draw and didn't draw preference tags in the lower pools are going to stick and stay. Many higher point applicants jump to lower point pools to draw lesser tags, some people stay, some point average, some are just clueless to how the draw works.

Look at the areas many people that apply in Montana and Wyoming put down as second and third choices for a prime example...clueless.
 
you mean other than the detailed hunt draw stats they publish day of the draw including yesterday?
Know of nothing mor granular than that.

Here is a snippet. It shows for example in unit 35 2 guys drew with <10 points and there were 2 applicants at that level. By definition that means two guys with 10 and 11 points respcetively pooled an app and had 10.5 points in the draw as a group. So for me I know that if I had 11 pts I would get a tag ahead of them , but if I pooled with buddies and we averaged 10.33 points we would be behind the guys with 10.5 pts

I think their data is pretty robust and reasonably gets me what I need to strategize while not having to cruch numbers to do it.

granted it is not a table of applicants per points level. To me it is one step better as it identifies pooled applications and pretty precisely how the tags were allotted, and tags remaining at each whole and partial point level as the draw proceeded.

View attachment 141187

This^

Although once you drop below the successful point pools...as in the 86 that applied with less than 7 points, you don't know how many of those had 6, 5, 4 etc.

It also gets muddy as many are applying for those units in hopes to draw on the random side, knowing full well they'll never get a tag in the preference pass. They figure rather than just buy a point, may as well shoot for a tag you might get lucky and draw on the random side.

That's tough to know what those applicants will do when they strike out enough times trying to draw a random tag, and why the data that I believe Badger55 is looking for, may not be all that useful.

Everyone looking for an edge in the point game, cant fault people for wanting to have all the data they can get.
 
My buddy got drawn for any elk, so I get to go, to a new area. I put in for a couple doe antelope tags in the same unit for a little variety, odds are slim.
Now going to apply for an Idaho cow elk hunt with a group, should be a fun fall.
 
  • Like
Reactions: LCH
Does anyone know where to find a more specific unit breakdown of application numbers? I emailed game and fish this winter and they gave me a chart but I think they misunderstood me. In the drawing odds they blanket all the applicants that are 1 or 2 points below the draw eg. <9 pp 136apps. I am just curious who is applying for the unit with 8points and how many with 7 points etc..

I'm pretty sure they have that information. You just have to know how to request it. WapitiBob has discussed this before. I think Toprut has that info but it is a pay to play service. You can go to their website and see some past years for free just to see if they have what you want. Go to the unit, Min Points, click more.
 
here is the chart I've been keeping up to date to keep an eye on the creep. If you follow the numbers horizontally, you can see the number of people with that many points just keeps going up. Its sickening as my goal was to get a tag in a unit that took 7 points when I started. It was around 3000 people with that many points. Right now its drawing with 9 which makes sense because there was 3119 people with 9 points going into the draw this year. Using this tread, by the time I hit 12 points, I should be able to draw it. Rough stuff...

View attachment 141179

Glad I'm not the only one who goes through the effort to keep "point creep" worksheets for states with preference point systems. We just did an Elk Talk Podcast on this topic. To add more to your sheet above, consider this for 2019 to 2020 in Wyoming.

Of the 1,612 max point holders, 532 actually applied for a tag by themselves or with other max point holders. The other 1,080 max point holders didn't apply. They just bought points. Of that 532 who applied, 133 actually drew a tag.

So, you get 1,612 total, of which 133 drew, leaving 1,479. Why were there only 1,381 folks who went into the 2020 draw with max points? The other 98 either bailed or did a party app and drew with a lower point holder such that they aren't listed in the max point pool for purposes of these charts.

Wyoming is burning through 200-230 max point holders each year who draw tags or just fall out of the system. Using 230 per year and assuming most of these folks are applying for the hardest to draw units, there will likely be 1,100 max point holders after the 2020 draw. It will take about 5 years to plow through that level of point holders.

If you are sitting at 2-4 points below max and you are waiting your turn for a max point tag, be patient or be lucky in the random draw, because the "max -1" level of point holders is being plowed through at an ever slower rate than max point holders and is an even bigger pool of people. It will likely take another seven years to plow through that layer of point holders at "max -1."

So, if you are "max -2," it will likely be 10-12 years before you are at the top of the point pool. That means your 12 points (max-2) going into this draw will be 22-23 points by the time you get to the top of the point pool. And you will have a lot of folks at your point level competing for that small number of "glory tags."

That's a lot of people just buying points every year, waiting their time. Even if Wyoming were to close the door on non-resident apps, the amount of point creep is going to increase substantially every year for the foreseeable future, due to the number of folks with double-digit points. It is for that reason I will be burning points every 2-3 years on GEN tags or maybe getting lucky in a random draw while I am building those 2-3 points.

The Wyoming charts are trending very close to the Colorado charts after the same number of years each system has been in place, with Wyoming having slightly less creep than Colorado at the same time. I attribute that to Wyoming giving 25% of the tags in the random draw, having an overall smaller pool of non-resident applicants than Colorado has, and having more units/tags that the non-resident max point holders can apply for.

It would be cool if the information was available to see how many who burn max points get completely out of the system or start back at the bottom and start building points again. The charts for Utah and Colorado are pretty much the same as Wyoming, or maybe I should say Wyoming is following Utah and Colorado, as those two states started Preference Points before Wyoming. Utah point creep is crazy bad, due to the high number of points holders just buying points and the low number of tags given to non-residents.

Yes, either I have too much time on my hands, or I have "issues" with numbers, or I just am too stubborn to throw away years of worthless spreadsheets that have no practical value other than to make me feel like I did something useful.
 
Last edited:
I had max (14) points. Despite late pref purchase changes, delayed draw, and covid there was still point creep. I got lucky and drew the only non res permit available in the regular pool with 25% odds.. thank you Wyoming!

Really looking forward to this hunt thread. Someone should tell the Hop Zone people to start working double shifts now.
 
Yes, either I have too much time on my hands, or I have "issues" with numbers, or I just am too stubborn to throw away years of worthless spreadsheets that have no practical value other than to make me feel like I did something useful.
Where have you been all my life as I could sit down and talk about this for hours and hours with you.... lol

Maybe after a week in elk camp together sipping coffee, glassing, etc....you know all that down time enjoying life and talking statistics we will have gone though it all
 
@Big Fin I have a passion to really start working the South Dakota game here soon as for the last 4 years I've just been building points...can you tell by this?

1590161686592.png
 
I don't know if they have that information, maybe but you'll probably have to request it and be specific.

I also don't think you'll be able to get much valuable information from that, people jump around chasing the latest rumors, etc. Its not like the people that applied in the draw and didn't draw preference tags in the lower pools are going to stick and stay. Many higher point applicants jump to lower point pools to draw lesser tags, some people stay, some point average, some are just clueless to how the draw works.

Look at the areas many people that apply in Montana and Wyoming put down as second and third choices for a prime example...clueless.
Haha yeah when i see the 2nd n 3rd choice it makes me laugh!
 
This^

Although once you drop below the successful point pools...as in the 86 that applied with less than 7 points, you don't know how many of those had 6, 5, 4 etc.

It also gets muddy as many are applying for those units in hopes to draw on the random side, knowing full well they'll never get a tag in the preference pass. They figure rather than just buy a point, may as well shoot for a tag you might get lucky and draw on the random side.

That's tough to know what those applicants will do when they strike out enough times trying to draw a random tag, and why the data that I believe Badger55 is looking for, may not be all that useful.

Everyone looking for an edge in the point game, cant fault people for wanting to have all the data they can get.
Yeah.. there some units in wyo that cluster up at pretty high points. I just like to look to the future and trend it. My group is spread out with points from 9 to 6. Plan is to pull a type 9 each year in a unit we know well.
 
I enjoy putting plans for future years together. I realize one of these years I will strike out both in montana and wyoming and will get to look elsewhere like a Colorado or Idaho. Ive just been spoiled with the montana seasons being able to archery and rifle hunt it each year.
 
Advertisement

Latest posts

Forum statistics

Threads
114,251
Messages
2,049,598
Members
36,528
Latest member
dgriess_91
Back
Top