Use Promo Code Randy for 20% off OutdoorClass

WY Antelope Point Creep

2020 WY Antelope Point Creep

  • Half a Point Creep

    Votes: 79 74.5%
  • No Creep

    Votes: 15 14.2%
  • Half a Point Recession

    Votes: 5 4.7%
  • A Point or More Recession

    Votes: 7 6.6%

  • Total voters
    106
There will be point creep simply due to more tag cuts and other western hunts becoming harder to draw....antelope in Wyoming have seen the biggest increase in interest of any species in Wyoming and perhaps any species in any state over the last 5 years. It will get worse before it gets better.
 
It has been said we needed a good ole fashion recession to cut down on western hunting budgets. Wyoming antelope will be a good litmus test for that claim. We have economic distress with a little pandemic mixed in.
I don’t think it will have a impact, but what the hell do I know.
 
It has been said we needed a good ole fashion recession to cut down on western hunting budgets. Wyoming antelope will be a good litmus test for that claim. We have economic distress with a little pandemic mixed in.
I don’t think it will have a impact, but what the hell do I know.

I think of all the applications, pronghorn may be the least impacted by recession. They're about the cheapest, easiest hunt Wyoming offers and doe tags are cheaper for NR's than a turkey tag.

I predict about the usual 1 point creep.
 
I have a question related to this topic, and forgive my ignorance if the answer is obvious.

Are lower tier units with less access or less trophy potential, numbers, etc. also less effected by point creep as a general rule? I suspect the answer to logically be yes in general but if an area has great trophy potential and little access I guess those able and willing to pay for access will still be in there applying for the units.

Coming from a State with very few lottery hunts this issue is fascinating to me. This is due in part to my desire to hunt out west and also because I can see Louisiana moving toward more lottery hunts in the near future especially for turkey but also for the recently delisted Louisiana Black Bear.
Yes to some degree. You used to be able to pick up a lot of those units in the left over draw, that really changed last year.
 
Regardless of what might happen temporarily this season, you can bet that there will be more and more people buying points only each year for the cost. Even if there was a dip this year it would likely go up next year. The tag reductions likely will have creep remain the same or even climb a bit even in the midst of a pandemic. Be intetesting to watch though.

I know we are having some serious contemplations on covid and border crossing before applying.
 
I don't see point creep changing for antelope. It is way too easy of a hunt for the average guy. Road accessible, accommodating terrain, visible game, easy to pack or just carry out whole, areas with guaranteed success on a buck, good for all fitness levels... I could go on forever. They are like the lowest apple on a tree that you can walk by and pull off without climbing up into the branches.
I think I just talked myself into an antelope hunt.
 
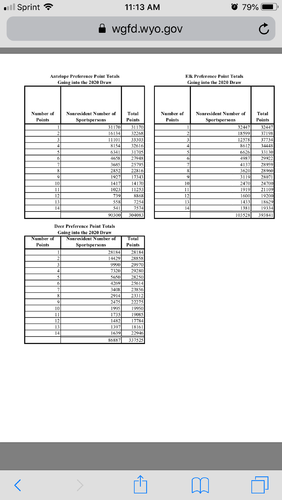
A tool I use to look at potential point creep in any state with a preference point system is to look at the data that shows how many people are buying points and at what point level. When you look at that information, you see how many people have 10+ points in many states for many species. That important piece of information ends up being completely ignored by the historical draw odds charts, as the draw odds only reflect those who actually applied.

When you look at the point piles from applicants standing on the sidelines, it will become very clear that there are a lot of people, some cases more than actually apply, standing on the sidelines and buying points that someday will be used. When those points are used, the app seemingly came out of nowhere, and created point creep to the dismay of those who thought this was their year.

I use last year's draw odds as a good indicator, but I rely heavily on these point buyer totals for predictive guessing. Yeah, it is all a guess to predict draw odds and point creep for the upcoming year. I've convinced myself, probably falsely convinced myself, that by adding point totals into about five other factors, including historical draw results, I can improve the "predictive guess." At least that is what I convince myself when I reflect on how much time I waste analyzing data that is probably irrelevant.

I suspect if most people looked more at the number of point buyers at each point layer, they may reconsider ever getting into the point game. Or, analyzing that information would at least temper their expectations of what is their realistic chance of drawing within 2, 5, 10, 15 years.
 
Last edited:
A tool I use to look at potential point creep in any state with a preference point system is to look at the data that shows how many people are buying points and at what point level.
Do most state fish and game websites have this information publicly available?
 
Do most state fish and game websites have this information publicly available?
WY does, although past years info doesn’t appear to be readily available. I’ve only looked at it for a few states, but I’ve been able to get it if I wanted it. Lots of guys around here that do a lot of this stuff probably have that info saved and bookmarked.

F904CD63-33BA-4BFD-86CE-0082FC66D87C.png
 
Last edited:
For every thread that talks about point creep, in this case WY pronghorn, and draw odds not being what they were 15 years ago, a few charts quickly remind me of the realities I've observed in my 25 years of applying and hunting in multiple states. Two charts can llustrate why point creep will grow every year. I accept it as part of western hunting and adjust my apps accordingly. And, do what I can for conservation to try reverse the trends of the first chart, no matter what species for which a chart might be presented.

The chart below is Colorado mule deer, an opportunity I always thought would be in great abundance. When I made my first non-resident app, it was for Colorado mule deer in 1993. At that time, I could have never imagined this decline. The chart would be even worse decline for mule deer in Nevada, Utah, Arizona, and New Mexico. The further back the first measurement is made (within the last 50 years), the steeper the decline for all species other than elk and sheep (depending upon the state).

Simply put, we have seen long-term declines in many species across many states. The supply component of the equation for most species, in most western states, is shrinking. That is something hunters can influence, albeit requiring lots of work, money, and advocacy. With more competing priorities placed on game and fish agencies, hunters need to be even more involved.
View attachment 138788
The demand part of the equation is increasing and has been increasing for many years, especially amplified as more Rocky Mountain states have to go to limited entry tags for some/all species in order to protect the resource from the impacts of growing populations. Add the increased interest in western hunting, both as western states grow in population resulting in increased resident tag sales, along with the number of non-resident hunters applying in western states who are displaced from their local hunting opportunities, and it is not that hard to see how point creep has increased and will continue to increase.

The trends of human population dynamics are not something likely to change and not much that hunters can influence. The demand part of the equation illustrated in the chart below will continue to grow.
View attachment 138790

I don't have answers for point creep, but when I look at these two charts and charts of many other species that have seen significant long-term declines, the only thing I know to do is keep working at the conservation efforts needed to put more elk, deer, sheep, and in this case, more Wyoming antelope, out in wild places. It takes time, money, advocacy, and priority. But, it is the best way I know that hunters can help increase draw odds and reduce the impacts of point creep.
2002 thru 2006 a buck behind every Juniper! Then when looking back at the ELK expansion/explosion in the 90's something had to give.
 
How many people are born in the US every year? Every year there's a new crop of hunters wanting to hunt out west, it isn't gonna level off.
Every year it's the same question; "will the odds be better because of (fill in the blank)? short answer, no.

I believe it is quite the contrary. Sure there is a steady flow of new hunters, but there will be a declining population of "boomers'' soon, some of which are max point holders. I believe it will get a little worst but within the next 10 years things will go down. Something that could affect things and make them worst are herd sizes which seem to be declining for some species. But I could be wrong...
 
I voted for a full point increase. A few weeks ago, I would have guessed otherwise but the other states have really shown no signs of slowing on apps or creep. I say 1 point in creep.
 
I chose half point but it will be something between .5 and 1. I got waylaid by pc last year. With 10 points I decided I wasn't going to catch the max point units so I put in with my son for a unit that 5.5 appeared to be a solid choice. We needed 6. This year we have 6.5 so I'm hopefull. If we could get a raw file with point total and birth year I think we could improve the probability equation by 10 to 15%. If we could add a couple more bits of information we could improve the probability equation by 30 to 40%. None of this would require releasing personal information. We're just taking baby steps on the odds calculation. So much more could be done.
 
As a follow-up, the most correct answer to the poll was the most popular answer. Half a point creep. Of the seven units I tracked, it took 0.79 points more to draw the same unit YOY in the regular draw and 0.14 points less to draw the same unit in the special YOY. Or an average of 0.65 points more for both draws.

I will admit that after seeing the elk draw results I revised my answer to a half point creep. Good luck to all this fall.
 
Something must have happened to the unit I normally apply for. Usually there is a decent chance to draw it in the random part of the special draw. Usually 20%+ odds. The applicants that ended up in the special random draw went from 42 in 2019 to 241 in 2020! Odds went down to 4%! It went from a 100% draw with 3 points in the special to a 28% draw with 4 points in the special. Regular pool was up as well.

2019 - 77 1st choice applications in the special draw, 349 1st choice applications in the regular draw for a total of 426 1st choice applications.
2020 - 271 1st choice apps in the special draw, 251 1st choice apps in the regular draw for a total of 522 1st choice applications.

That is a 251% increase in the applications for the special draw and a 28% decrease in apps for the regular draw. On the resident side there was a modest increase but nothing like the nonresident special.

It ended up being one of those deals where the special draw actually had worse odds than the regular draw in the random side.

Not sure if someone shot a big buck in the unit last year or if it showed up as a blue chip on someones western drawing application strategy or what happened.

Oh well. I get to focus 100% of my attention on my son's youth any bull tag in Utah this year.
 
Well, something creeped because the tag I should have drawn today in the special draw didn't fall my way, was planning to take my daughter along for her first antelope hunt :mad:
 
77% of HT’ers guessed half a point of creep and that is about what my first choice unit creeped and why I came up short and didn’t draw. I should’ve given more credence to the predictive abilities of the HT crowd. Hell, I predicted half a point creep on this poll and then didn’t take it into account with my application strategy. Stupid, stupid me.
 
Back
Top