Going through the last-minute application motions here. Since I have the OnX membership, and that includes access to TopRut, I thought I'd use it. Could be a very friendly interface, but with a fair amount of confusing data, and maps that don't work as intended (maybe they're not integrated with the new MT Pronghorn units), I'm not exactly a fan.
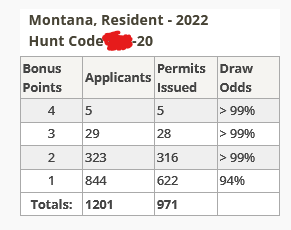
What I'm mostly seeing here are numbers that don't make sense- 28 permits issued out of 29 applicants is not >99% odds of drawing (neither is 316 out of 323). The only logical explanation for what's below is there are residents that applied in a party application with nonresidents, or they are showing the "odds" of drawing from the previous year against the drawing results of that year. Does anyone know what's going on?

Either way, it forced me to go into the raw data and do my own chart making. I guess I know where I'm applying.
What I'm mostly seeing here are numbers that don't make sense- 28 permits issued out of 29 applicants is not >99% odds of drawing (neither is 316 out of 323). The only logical explanation for what's below is there are residents that applied in a party application with nonresidents, or they are showing the "odds" of drawing from the previous year against the drawing results of that year. Does anyone know what's going on?

Either way, it forced me to go into the raw data and do my own chart making. I guess I know where I'm applying.


