D
Deleted member 28227
Guest
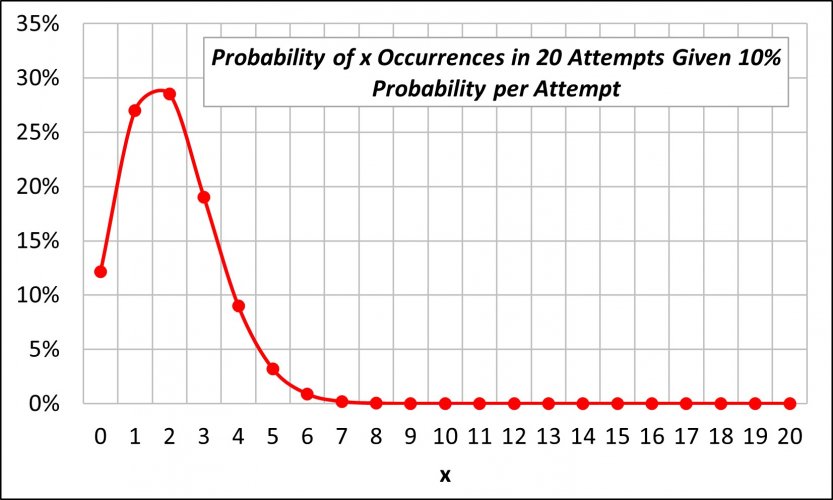
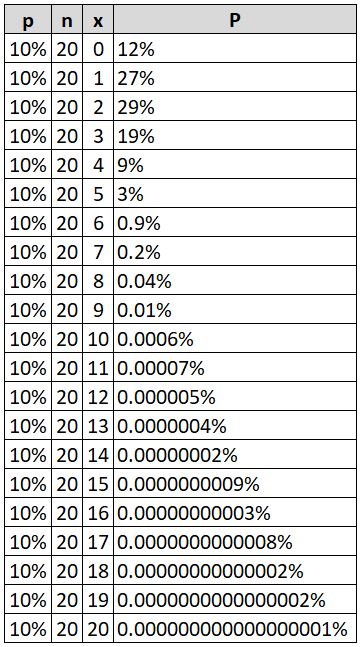
Yeah I understand how it works... that graph is from top rut like I said @BrentD is just showing the odds in one year of folks at every level of points there is no time component. To your point Brent to model reality you would need to take the probability curve of a random draw and then add a growth curve for the next 20 years.So that's pretty good information. But let me throw a wrench in your work just to get you thinking. Keep an open mind for a minute. Please feel free to add input. When people use random odds they think of it like 10 people 1 tag. Odds are 1 in 10. 100 people 10 tags same, 1 in 10 right?
So if you think of random draws as a giant hamster wheel full of ping pong balls. Let's say 100. And we are drawing 10. (Just keeping numbers simple.) We draw 1 ball...
His odds where 1 in 10 or 10%. (1 in 100 but 10 spins around remaining) easy.
Now we draw ball number 2. His odds were.... 1 in 11 or 9%. (1 in 99 with 9 spins to go.
Ball 3. 1 in 12.3 or 8.1%.
Wait.... it keeps getting lower.
That's how random draws work. You end with an average odds just shy of double against you compared to what most people think. 1 in 19. Which is why when you run out actual random draws in a ball pulling experiment until you've drawn everybody. At 20 years the curve almost zeros. You've pulled almost every ball after 20 years of draws. But never everyone. Some guys draw 2 or 3 times and other numbers NEVER get pulled. So your lotto line should be about 2.4 percent. Random draws are not what they are sold as either.
When I get a day off I'll graph the probabilities a little better so you can see what I mean by curves. It will take a day to do, draw, photo, and explain the process.
@Firedude to take this one step further the reason I think we are missing each other is that I think there is a good argument for points systems over random up until a point, that's kinda what you are modeling and expressing, and I agree... but its a different argument when the odds are already long.
So 1-5 years to draw= Pref points better
1-15 years to draw = bonus or bonus squared
20+ years to draw ie once in a lifetime = random
* years to draw meaning cumulative odds over multiple years being ~95%
That all being said there is a psychology aspect in that random systems tend to not have as many players so it actually improves odds, see bear argument above, and second players don't like having multiple highly different draw systems, especially for the same species.
My preference for system has varied a bit over the years, I'm leaning towards random as it is easier for folks to understand and like I said less players, but my alternative best system would be the Colorado MSG system which is preferences points then weighted points.
Last edited by a moderator:


