Caribou Gear Tarp

I made a free draw odds site for Montana

Well, I'm excited to start messing with the probability of drawing and showing that on the site so I appreciate the input @neffa3 and @YoungGun.

I also just added moose, sheep, and goat CSV to my database and now those stats are alive on the site as well. So now everyone can check those out on my site.
 
Last edited:
The one biggest hitch is simply that last year, or any previous years, are not necessarily indicative of the future.
I think the application of past results for Montana is further complicated by the hunting district changes last year, so for deer and elk we're stuck with one year of data for a lot of tags/permits. I also feel like there must be a bit of a pendulum back and forth for some units based on past draw odds - for example, FWP's 2021 spreadsheets showed that the elk permits (that allowed cow or bull harvest) for two local HD's were 50% and 100% with 0 points, respectively. Those permits were changed into B tags, and 2022 spreadsheets show that for one the odds with 0 points were 6%, while the other was still 60%. Maybe I'm overthinking it and most people do less research, but I have to imagine more people are going to apply for the second one this next year, which will mean greater odds for the first unit and worse odds for the second if tags stay the same. May not really affect elk and deer permits, but I'd guess it would for antelope and B tags.
 
Atlas, thanks for sharing! This is certainly more streamlined than the spreadsheets most of us refer to from FWP.

I could be off in my understanding of how Montana "squares" bonus points, giving those with even a few more points many more "tickets" in the proverbial hat. But would I be wrong in saying that one could potentially figure their "straight" odds using historical data by dividing their total number of tickets by the calculated average of historical tickets for any given hunt? Of course I am making the assumption that no bonus points = 1 ticket, 1 bonus point = 2, 2 bonus points = 4, 3=9 and so on.

So if there were a unit where historically there were 9 total applicants that generally averaged 5 bonus points, and I had 2, I would have 1.7% straight odds (25 tickets/applicant x 9 = 225 + my 4 = 229 total. My 4 "tickets"/229 "total tickets" = 1.74%). Of course I'm not including the 90/10 split, which would present a whole new level.

If anyone knows how this works in a more in-depth manner, please educate me!
I was thinking the same thing, this seems like it would be the correct approach, or at least as close as might be feasible to predict?

And good job Atlas! Thanks for sharing.
 
Yeah, I think some here are assuming you’re showing actual draw odds. Not to say what you’re showing isn’t valuable or interesting, but just because 2 dudes out of 20 drew at your point level doesn’t mean your draw odds were 10%. Just like it doesn’t mean that the guy who won the power ball lotto had a 100% chance to win.

For some of these states, calculating actual draw odds will be next to impossible without running millions of draw simulations. Even Montana’s draw, especially for NRs, gets tough when you try to simulate the NR cap.
Simulating the non-res cap is easy. Two equations. Use one when the percentage of NR apps that make up the total apps is or below the cap. Use the second equation when the percentage of total apps that are NR is above the NR cap. If the NR cap is 10%, you would use one equation when NRs made up 10% less of total apps, and the second equation when NRs were over 10%. The second equation would account for the probability that the cap was met before your app came up. That’s not that hard to do.


NM draw odds are difficult to calculate. I suspect it’s possible but I haven’t figured out how to do it. Perhaps if I was not 13 years removed from my last statistics class I could figure it out or know if it was possible. One thing is for sure, time consuming simulations will get you to the same answer.
 
Yeah but that doesn’t take into account the extra tags added by the legislature any given year, or the extra tags issued when FWP screws up a draw.

Just when you think you have it figured out, here’s FWP:
I only said accounting for the NR cap was easy.
 
What a jag off. I hope you slip and fall on your b tag fest this fall.
Ok well that seems harsh lol . Some folks take things way too seriously. I just think and know from experience that I can figure out what draw odds were and what I think they will be on my own it’s not hard - but I will give the OP credit for offering this site of his up for no cost . He obviously spent alot of time on it so I truly do wish him good luck I hope it gets plenty of views .
 
For WA, which uses a bonus point system for special draws, I use last years total applicants and the avg points of all of those applicants to generate a total number of entries for each hunt compared to my potential total number of entries divided by the number of tags. While it is not quite accurate, it is consistent therefore giving you a basis for comparisons and it's really not that far off, I've pulled the actual records for various hunts with the differing distributions of points by applicants and found the true odds I'd draw are different than my method above, but only by a couple of percent, maybe that because WA has many hundred if not thousands of people applying for each hunt so the variability is washed away by the shear quantity of applicants; IDK. The one biggest hitch is simply that last year, or any previous years, are not necessarily indicative of the future.
Cool site @atlas.
I did some work with the WY draw odds. My conclusion is determining predictive draw odds isn't hard. The chances of them being right can vary. I think of it this way- I can put in the numbers and run a monte carlo simulation of 1000 runs find the average of the simulations and tell you with some high statistical confidence (95%) that the results will be in that range around the average. The problem is the actual draw is just one run. And if we are talking about WY NR general elk, I have a lot more confidence in the estimate than I do for an estimate for MT Sheep in unit X. In the end, just using more simple estimates are going to get you close enough, but regardless, mileage will vary.

That's pretty cool you did that with Wyoming odds. I thought that a simple estimate would be the most practical. When I do add estimates, I will have to clarify that I am really only estimating the probability of drawing last year though. As others have mentioned things can change from year to year, something like social media promotion of units or changing tag allocation can quickly make an estimate obsolete.

Also, if people haven't checked the site in a while I made deer and elk b tags available a couple of days ago. In building out the site, I made sure to make it as easy as possible to quickly update the odds when FWP publishes the statistics next year. I want to maintain the site with very little future work from me.
 
Looking forward to exploring the site. It’s always helpful to have more tools at our disposal.
 
Interesting site. My draw odds went from a 0.almost nothing% (kind of like the interest banks pay savings accounts) on the FWP statistic table to a positive 2 or 3% on your table with my maximum number of squared bonus points. But it's still a random draw and even a first time applicant can win.
 
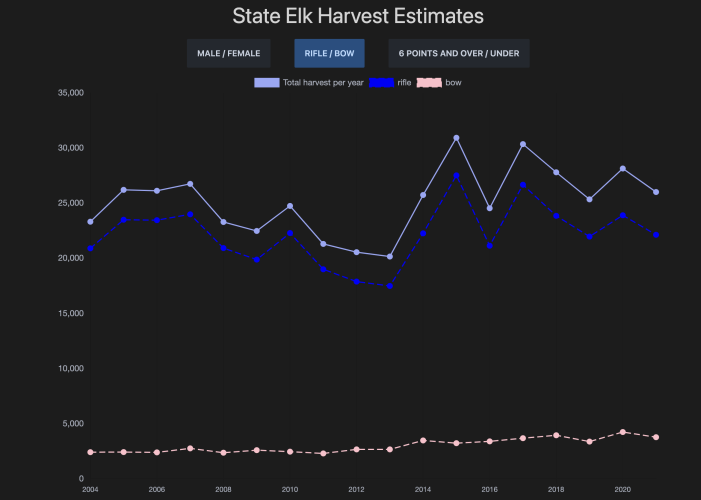
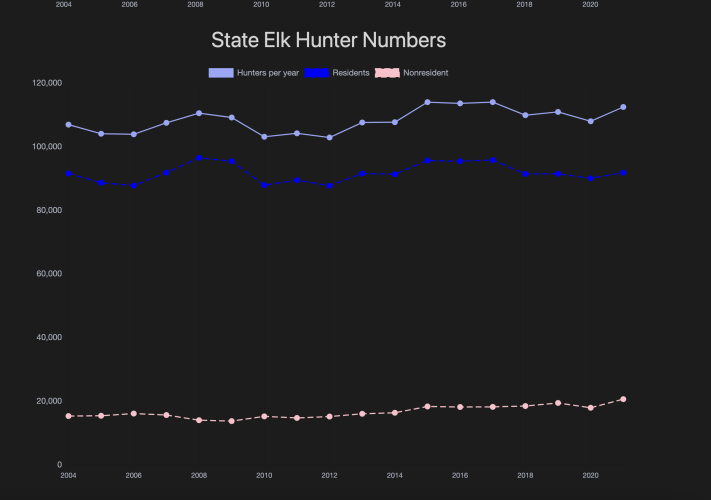
Ok, so I'm starting to give harvest estimates a look and will get them into the site shortly.

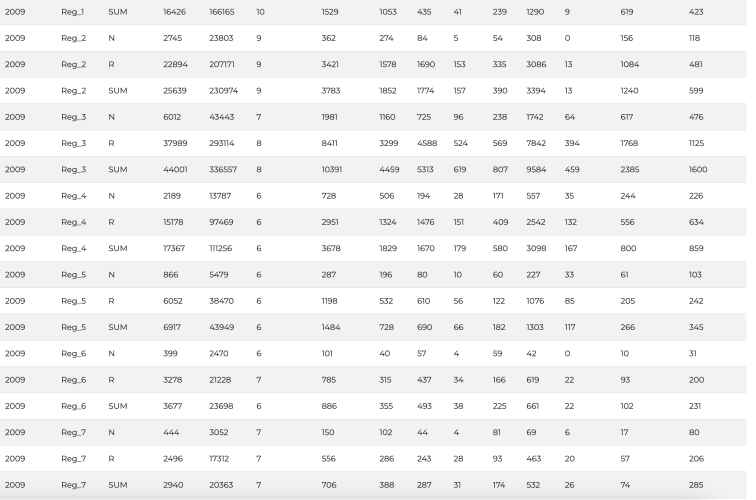
First I had a question that hopefully one of you will be able to answer. I'm looking through the data and I see 1XX, 2XX, 3XX.... etc. as units. I was wondering what that represents. It definitely isn't the sum of all the harvest in that region as that is described in the data by reg_1, reg_2, reg_3,... etc. If I can't figure out what they mean I'll probably have to ignore the stuff with Xs.

Also, I was thinking about unit boundary changes and how that will complicate things when the 2022 harvest results come out. I will likely just make a footnote on the graphs stating that it is a unit that changed boundaries in 2022.

Screenshot 2023-02-10 at 8.46.19 AM.png
Screenshot 2023-02-10 at 8.46.06 AM.png
Screenshot 2023-02-10 at 8.46.43 AM.png
Screenshot 2023-02-10 at 8.47.23 AM.pngScreenshot 2023-02-10 at 8.47.41 AM.png
 
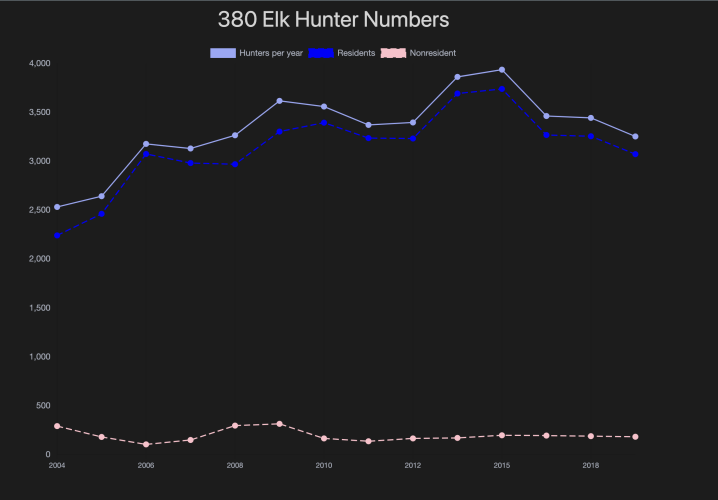
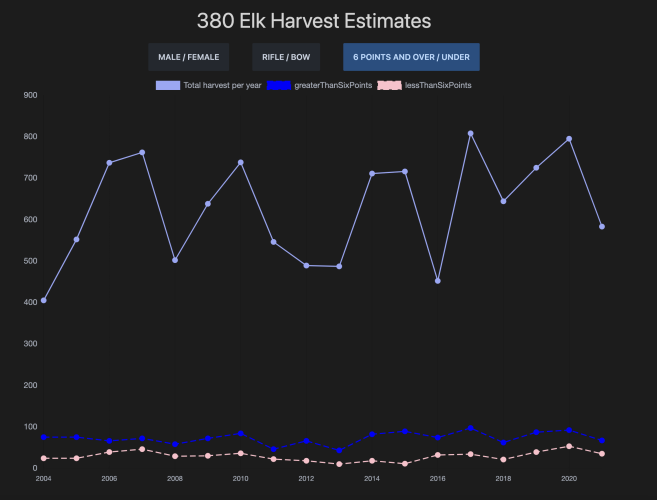
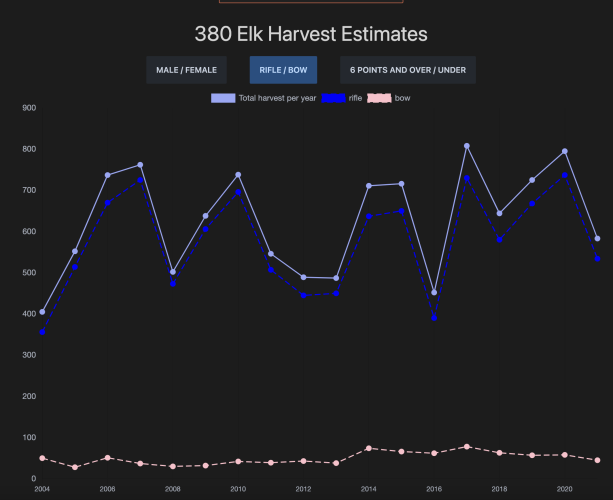
Here is the new feature I'm working on. You'll be able to query data from every district, so it should provide some value for looking at general units.
Screenshot 2023-02-13 at 8.42.33 AM.pngScreenshot 2023-02-13 at 8.42.23 AM.png
Screenshot 2023-02-13 at 8.44.35 AM.png
 
It's not live on the site yet but it will be soon.
 
Last edited:

Latest posts

Forum statistics

Threads
113,656
Messages
2,028,715
Members
36,274
Latest member
johnw3474
Back
Top