Nameless Range
Well-known member
I was lying in bed the other day thinking about the new Elk Management Plan, how much hinges on it, and what it will look like. Based on some of the questions I heard asked in the meetings I attended, the individual hired to write it, and the near-unanimous position of hunters in Montana on the unreasonableness of current elk objectives – I’ll admit I have a tinge of hopefulness, with the realistic recognition of the likelihood of a few grenades.
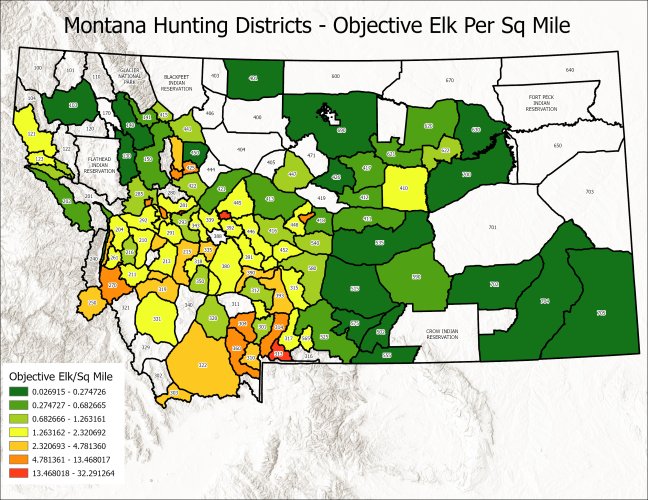
But I got wondering about my own home distict – a district with an objective that is far too low, and how many elk are actually here, and how many there are per square mile.
Now, one can’t really draw conclusions from any of these maps. Not all districts are created equal. Different habitats, public vs private, irrigated vs rangeland. All considerations. One thing that is kind of shocking when looking at the current objectives, is they don’t even have them for many districts and they don’t count elk in them either. Some "holes" in the data are just that, others, such as 321 (The Sapphires), just have "no wintering elk observed."


Montana gives out this pdf containing all the objective information, as well as the latest observed. They also turn loose shapefiles of the districts, but an incongruency exists between the GIS data and the tabular garbage in the PDF. Makes such analysis difficult.
Some notes:
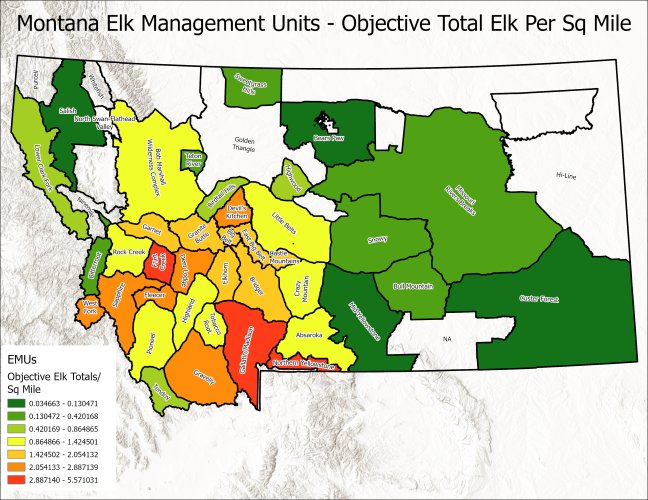
-There’s quite a few examples of multiple districts sharing one objective. The objective for 350 and 370 has always been 600. Now, the proper thing to do in that instance, where multiple districts share an objective, would be to divvy up that objective total by a relative proportion of the geographic area of the combined whole. But I’m too lazy. Also, I know in those two districts south of me, uneven in size, that share one objective, a the bio just splits the objective in half for each (300). So where multiple districts share one objective, I just gave each an even piece of the pie.
-Where two districts are split into portions (331 East and 331 west are one district, but each portion has different objectives) I combined the sum of two portion objective numbers for the single district.
-For some districts it is a discrete number, and for others it is a range. In this instance, I used the highest end of the range.
By District

By Elk Management Unit (EMU)

Ultimately, the map that breaks elk per square mile up by Elk Management Unit is likely more useful, and telling. There are some districts with a high amount of tolerance, and others that seem so low it’s silly (700 for example).
Either way, I made these out of my own curiosity, and not in the name of any grandiose statements and analysis. You'd have to go a lot deeper and clean things up. It would be interesting to see Montana's objective elk per sq mile against other states. Here's to hopin' the new EMP is a bit more realistic.
But I got wondering about my own home distict – a district with an objective that is far too low, and how many elk are actually here, and how many there are per square mile.
Now, one can’t really draw conclusions from any of these maps. Not all districts are created equal. Different habitats, public vs private, irrigated vs rangeland. All considerations. One thing that is kind of shocking when looking at the current objectives, is they don’t even have them for many districts and they don’t count elk in them either. Some "holes" in the data are just that, others, such as 321 (The Sapphires), just have "no wintering elk observed."


Montana gives out this pdf containing all the objective information, as well as the latest observed. They also turn loose shapefiles of the districts, but an incongruency exists between the GIS data and the tabular garbage in the PDF. Makes such analysis difficult.
Some notes:
-There’s quite a few examples of multiple districts sharing one objective. The objective for 350 and 370 has always been 600. Now, the proper thing to do in that instance, where multiple districts share an objective, would be to divvy up that objective total by a relative proportion of the geographic area of the combined whole. But I’m too lazy. Also, I know in those two districts south of me, uneven in size, that share one objective, a the bio just splits the objective in half for each (300). So where multiple districts share one objective, I just gave each an even piece of the pie.
-Where two districts are split into portions (331 East and 331 west are one district, but each portion has different objectives) I combined the sum of two portion objective numbers for the single district.
-For some districts it is a discrete number, and for others it is a range. In this instance, I used the highest end of the range.
By District

By Elk Management Unit (EMU)

Ultimately, the map that breaks elk per square mile up by Elk Management Unit is likely more useful, and telling. There are some districts with a high amount of tolerance, and others that seem so low it’s silly (700 for example).
Either way, I made these out of my own curiosity, and not in the name of any grandiose statements and analysis. You'd have to go a lot deeper and clean things up. It would be interesting to see Montana's objective elk per sq mile against other states. Here's to hopin' the new EMP is a bit more realistic.


